
April 18, 2024

| “… they think we shall see for the first time in a decade two years with back-to-back growth.” |
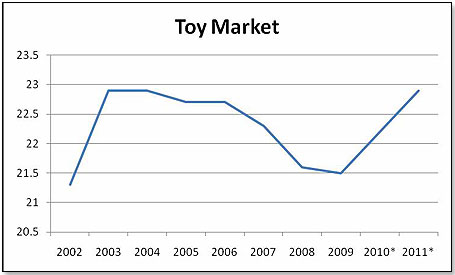
 During this year’s Toy Fair and its aftermath, it became very clear that the buyers on my retail panel are taking a much more positive view of the U.S. toy market than they did a year ago. There are several reasons for this, but, in summary, they think we shall see for the first time in a decade two years with back-to-back growth. However, just to put this into perspective, even if they are right, the 2011 toy sales will, at best, equal toy sales in 2003.
|
Price
|
SKUs
|
%
|
|
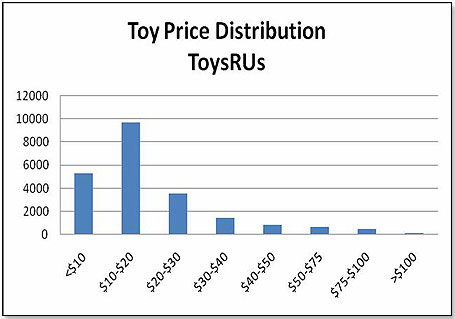
<$10
|
5,292
|
24.1
|
|
$10-$20
|
9,692
|
44.1
|
|
$20-$30
|
3,519
|
16.0
|
|
$30-$40
|
1,422
|
6.5
|
|
$40-$50
|
818
|
3.7
|
|
$50-$75
|
641
|
2.9
|
|
$75-$100
|
481
|
2.2
|
|
>$100
|
129
|
0.6
|
|
|
21,994
|
100.0
|
|
|
|
|
|
Movie Titles 2010
|
Release
|
Toy Licensee
|
Box Office
Last Movie*
|
Date Last
Movie
|
|
Avatar
|
12/27/09**
|
Mattel
|
None
|
None
|
|
How to Train Your Dragon
|
3/26/20
|
Spin Master
|
None
|
None
|
|
Iron Man 2
|
5/7/10
|
Hasbro
|
$228.6 M
|
2008
|
|
Prince of Persia: The Sands of Time |
5/28/10
|
Playmates/Vivid
|
None
|
None
|
|
The Last Airbender
|
7/2/10
|
Spin Master
|
None
|
None
|
|
Avatar [long version]
|
10/1/10
|
Mattel
|
$552.8 M
|
2009/10
|
|
Harry Potter and the Deathly Hollows: Part 1
|
11/19/10
|
Tomy/Neca
|
$294.2 M
|
2009
|
|
Tron Legacy
|
12/17/10
|
Spin Master
|
$33.0 M
|
1982
|
|
The Chronicles of Narnia: The Voyage of the Dawn Treader
|
12/17/10
|
Jakks Pacific
|
$135.5 M
|
2008
|
|
Movie Titles 2011
|
|
|
|
|
|
Thor
|
5/6/11
|
Hasbro
|
None
|
None
|
|
Green Lantern
|
6/17/11
|
Mattel
|
None
|
None
|
|
The Adventures of Tintin: The Secret of the Unicorn
|
6/23/11
|
|
None
|
None
|
|
Transformers 3
|
7/1/11
|
Hasbro
|
$393.7 M
|
2009
|
|
Pirates of the Caribbean 4: On Stranger Tides |
7/2011
|
No licensee at this point***
|
$301.7 M
|
2007
|
|
|
|
|
|
|
|
Harry Potter and the Deathly Hollows: Part 2
|
7/15/11
|
Tomy/Neca
|
$294.2 M
|
2009
|
|
The Hobbit
|
12/11
|
****
|
$345.5 M
|
2003
|
*U.S. only to Week 7 inclusive
**included in 2010 line-up as release date was after Christmas 2009
****Marvel’s Toy Biz had the license in 2003
|
Movie Titles 2010
|
Release
|
Toy Licensee
|
Box Office
Last Movie*
|
Date Last
Movie
|
|
|
Sorcerer’s Apprentice
|
5/16/10
|
None appointed
|
None
|
None
|
|
|
Shrek Forever After
|
5/21/10
|
Playmates/Vivid
|
$307.8 M
|
2007
|
|
|
Toy Story 3
|
6/18/10
|
Mattel/Thinkways
|
$245.6 M
|
1999
|
|
|
Movie Titles 2011
|
|
|
|
|
|
|
Jack the Giant Killer
|
2011
|
?
|
?
|
1962
|
|
|
Kung Fu Panda: The Kaboom of Doom
|
6/3/11
|
Mattel
|
$206.6 M
|
2008
|
|
|
Cars 2
|
6/24/11
|
Mattel
|
$220.0 M
|
2006
|
|
|
The Smurfs
|
7/29/11
|
Jakks Pacific
|
$11.2 M
|
1983
|
|
*U.S. only to Week 7 inclusive
|
Movie Titles 2010
|
Release
|
Toy Licensee
|
Box Office
Last Movie
|
Date Last
Movie
|
|
Alice in Wonderland |
3/5/10
|
Mattel
|
?
|
1951
|
|
Tangled [Rapunzel]
|
12/1/10
|
Mattel
|
None
|
None
|
|
Movie Titles 2011
|
|
|
|
|
|
Brave [The Bear and the Bow]
|
12/24/11
|
Mattel
|
None
|
None
|
*U.S. only to Week 7 inclusive
Copyright © 2024 TDmonthly®, a division of TOYDIRECTORY.com®,
Inc.