U.S. Department of Commerce Industry Report
Dolls, Toys, Games, and Children's Vehicles NAICS Code 33993
Industry Definition
NAICS 339931 comprises establishments primarily engaged in manufacturing complete dolls,
doll parts, and doll clothes, action figures, and stuffed toys. NAICS 339932 comprises
establishments primarily engaged in manufacturing games and game sets for adults and
children, and mechanical and non-mechanical toys. Establishments primarily engaged in
manufacturing electronic video game cartridges and non-doll rubber toys are not included. The
information in this industry report aggregates the industry data for both NAICS codes.
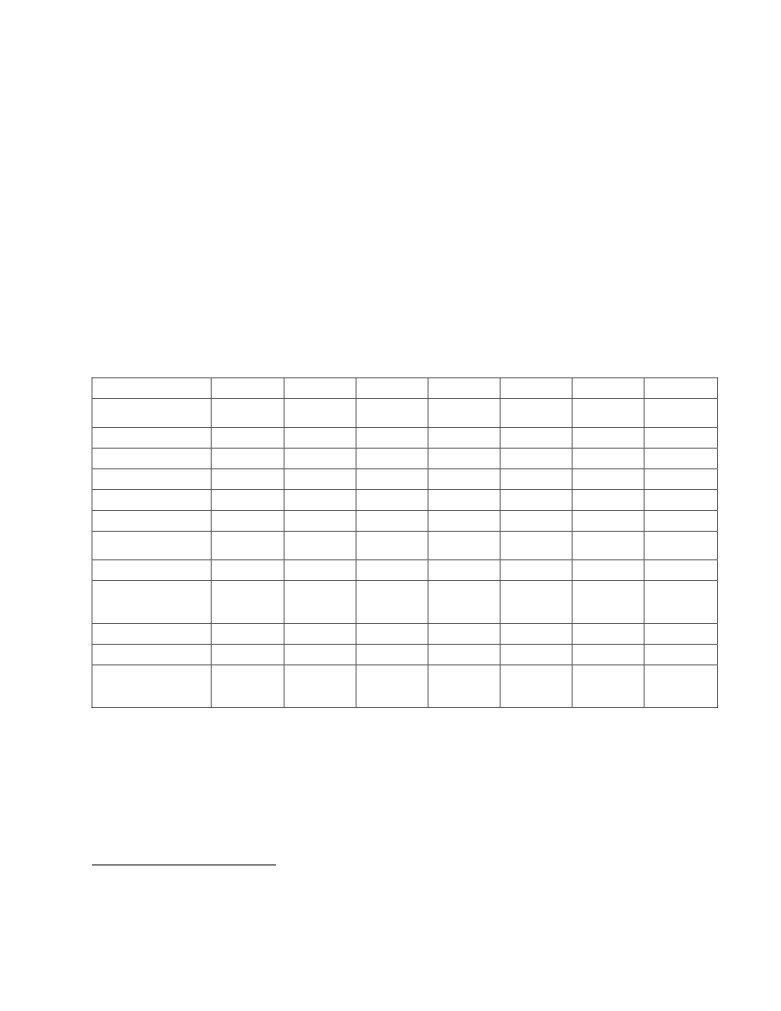
Current Economic Indicators NAICS 33993
See the table below for a complete listing of the current economic indicators for the toy
industry1.
2004
2005
2006
2007
2008
2009
2010
Total Value of
Shipments
$3,558,885
$3,721,741
$3,904,760
$3,021,754
$2,861,473
$2,115,219
$2,307,707
Product Shipments
$3,180,434
$3,284,022
$3,431,119
$2,526,067
$2,568,226
$1,882,415
$2,076,556
$880,493
$1,070,187
$1,325,192
$1,983,033
$1,554,128
$1,582,753
$1,531,789
Exports
$14,244,081
$16,243,647
$16,971,999
$21,768,888
$22,820,281
$20,423,985
$21,427,885
Imports
Apparent
Consumption
$16,922,473
$18,895,201
$19,551,567
$22,807,609
$24,127,626
$20,956,451
$22,203,803
Imports as a % of
Apparent
Consumption
84.17%
85.97%
86.81%
95.45%
94.58%
97.46%
96.51%
$12,053,678
$13,439,770
$14,592,830
$19,446,731
$20,677,929
$18,330,413
$18,979,444
Imports from China
Imports from China
as a % of Apparent
Consumption
71.23%
71.13%
74.64%
85.26%
85.70%
87.47%
85.48%
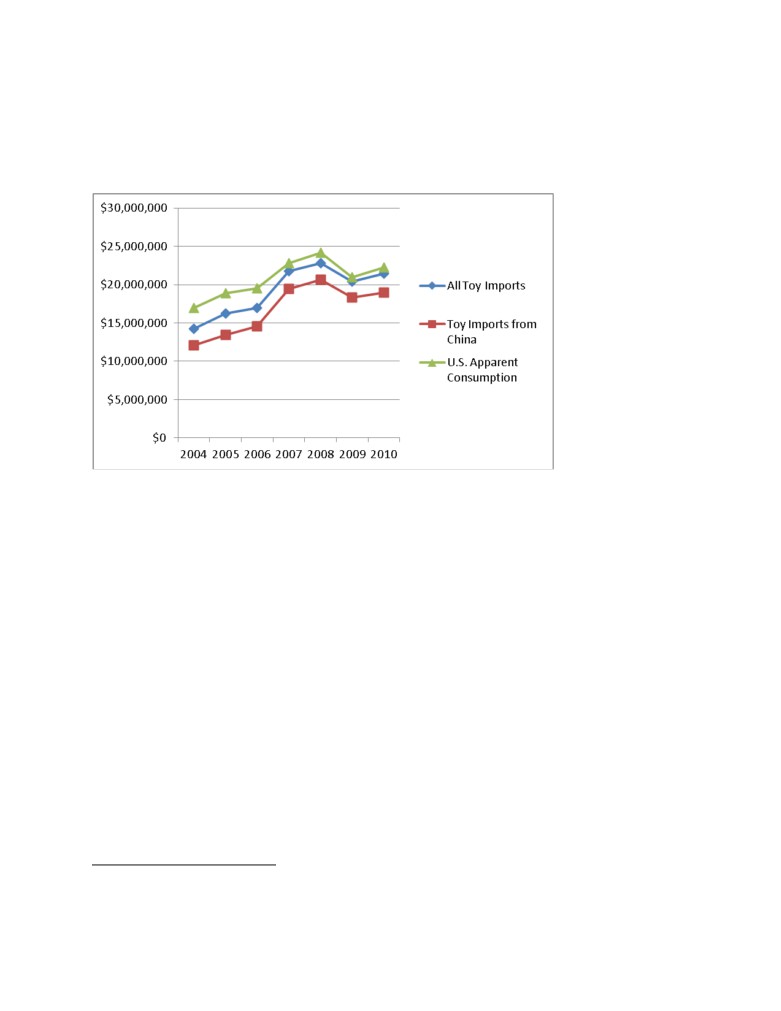
The industry's domestic production in 2010, the latest year of available data, was estimated at
approximately $2.076 billion. While the majority of toys destined for the American market are
designed in the United States, large-scale production has shifted abroad. However, even
though large portions of the major U.S. toy companies' product lines are manufactured outside
the United States, they still incorporate significant U.S. value in terms of the product design,
marketing, research and development, and corporate support functions. While U.S. toy
1 This report uses the most recent full year data, 2010. Sources: U.S. Census Bureau's Annual Survey of
companies have their own toy development divisions, they also support a network of
independent toy inventors and designers that sell their concepts to the larger companies. The
largest U.S. toy trade association, Toy Industry Association (TIA) has resources that toy
inventors and designers can use to market their products to manufacturers. TIA organizes one
of the world's largest toy trade shows. Held each year in February in New York City, Toy Fair
attracts more than 20,000 attendees and 12,000 exhibitors in 350,000 square feet of exhibit
space.
TIA estimates domestic toy related employment at 31,000. TIA member companies employed
approximately 26,215 U.S. workers in 2009. TIA employment figures capture all toy related
operations including independent toy inventors and designers. The Bureau of Labor Statistics'
Quarterly Assessment of Employment and Wages estimated 2010 employment at 11,886, down
from 12,881 in 2010.2 The Census Bureau's 2010 Annual Survey of Manufactures (ASM)3, a
sampling of manufacturing operations, estimated manufacturing related employment at 9,137.
Toy Sales
The U.S. Toy Industry Association, TIA, estimates that U.S. retail sales of traditional toys were
$21.78 billion in 2008, up 2 percent from 20094. TIA member companies reported that the toy
categories of Dolls, Building Sets and Outdoor & Sports toys saw the strongest growth in 2010,
while Youth Electronics, Action Figures & Accessories, and Games & Puzzles saw the largest
drop.
TIA estimates that the worldwide retail sales of toys totaled $80.280 billion in 20095. The top
ten markets by retail sales were: United States; Japan, China, the United Kingdom, France,
Germany, Brazil, India, Australia, and Canada. Annual toy spending per child in these markets
ranged from a high of $401 in Australia to a low of $6 in India.6
2 https://www.bls.gov/cew. Major exclusions include self-employed workers.
survey of approximately 50,000 establishments.
4 The term "traditional toys'' does not include video games. TIA's "State of the Industry Table� available at:
81a73a-ce46-4caf-8bc1-72b99567df1e#.UXGj0qw8_ng
5 TIA commissioned report "Toy Markets in the World: Summary Charts Annual 2009'' by the NPD Group available
6 Ibid.
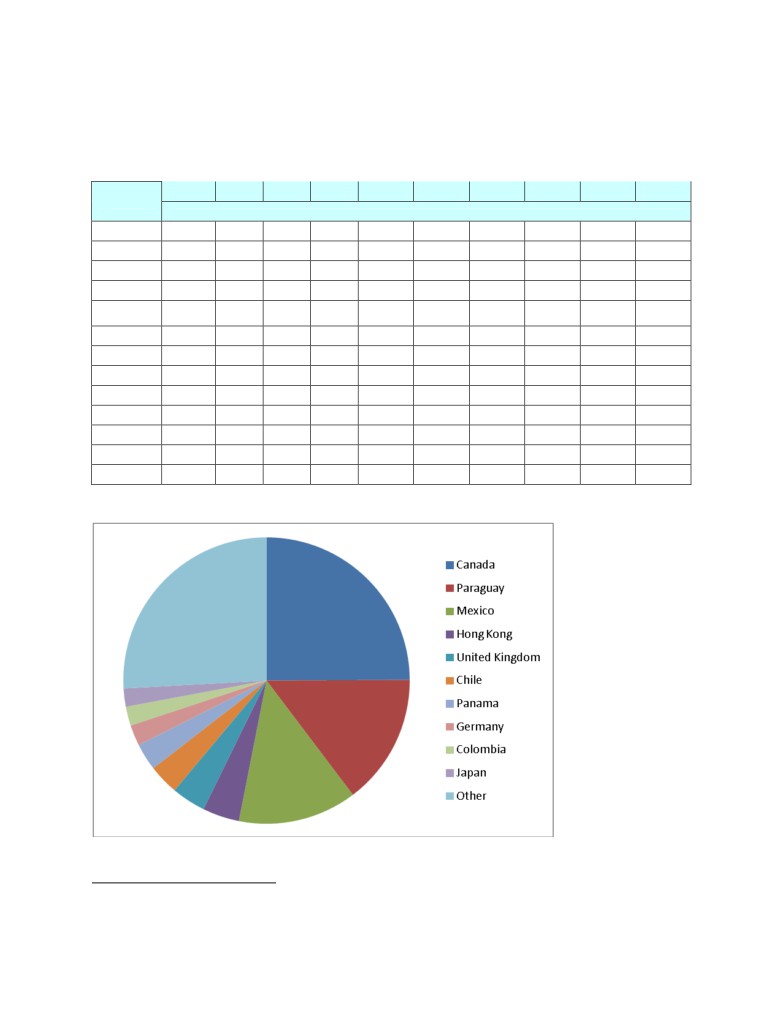
U.S. Exports and Imports of NAICS 33993
U.S. trade statistics don't reflect the global strength of the U.S. toy industry since the majority of toys
consumed in the U.S. are imported or produced regionally to serve specific markets. The U.S. toy
industry exported $1.531 billion in 2010 a decrease of 3.2 percent from 2009.
Toys, Dolls, and Games NAICS 33993: FAS Value U.S. Domestic Exports7
2001
2002
2003
2004
2005
2006
2007
2008
2009
2010
Country
In 1,000 Dollars
Canada
293,472
319,731
337,921
315,458
443,826
433,283
540,887
376,955
367,525
381,652
Paraguay
12,490
15,478
34,803
26,176
16,306
34,424
37,183
99,898
163,015
226,508
Mexico
128,249
88,520
68,873
81,188
78,699
233,321
749,717
324,323
229,555
205,271
Hong Kong
29,343
44,627
52,523
46,902
54,559
71,809
106,324
69,043
82,470
63,552
United
70,613
68,025
65,745
71,811
75,387
76,536
72,676
74,359
71,177
59,067
Kingdom
Chile
6,915
5,451
6,752
5,669
30,618
36,085
31,501
47,421
39,452
52,227
Panama
5,138
5,852
5,403
5,757
8,696
11,982
24,188
55,816
49,508
46,806
Germany
20,244
21,728
16,246
20,436
16,692
16,816
17,544
15,497
18,867
35,909
Colombia
9,942
8,116
8,357
8,009
12,452
20,712
24,512
35,872
35,424
32,926
Japan
64,013
57,669
51,212
41,062
45,230
33,446
28,658
30,208
30,667
31,494
Subtotal :
640,419
635,198
647,834
622,469
782,464
968,414
1,633,189
1,129,394
1,087,661
1,135,411
All Other:
226,491
199,837
214,922
258,024
287,723
356,779
349,844
424,735
495,092
396,378
Total
866,910
835,036
862,756
880,493
1,070,187
1,325,192
1,983,033
1,554,128
1,582,753
1,531,789
2010 Toy Exports NAICS 33993 (In $1,000)
7 ITA does not consider Paraguay's imports of U.S. manufactured toys to be indicative of Paraguay's domestic
consumption.
The top five export destinations were Canada, Paraguay, Mexico, Hong Kong, the United
Kingdom, and Chile. Combined, Canada, Paraguay, and Mexico accounted for 53 percent of toy
exports.
The toy industry imported $21.427 billion worth of toys, dolls and games in 2010, an increase of
5 percent over 2010 levels.
Toys, Dolls, and Games NAICS 33993: Customs Value U.S. Imports for Consumption
2001
2002
2003
2004
2005
2006
2007
2008
2009
2010
Country
In 1,000 Dollars
China
8,742,865
10,428,832
11,660,592
12,053,678
13,439,770
14,592,830
19,446,731
20,677,929
18,330,413
18,979,444
Japan
3,206,034
2,055,828
690,227
604,364
1,270,560
885,981
843,295
758,488
741,681
692,406
Mexico
552,629
1,029,327
395,910
317,211
318,359
312,178
304,603
294,328
276,086
339,744
Denmark
122,514
135,999
89,721
98,434
115,753
129,908
163,019
108,428
205,568
278,733
Canada
193,475
177,410
159,007
141,325
134,937
106,009
89,158
104,653
109,226
240,197
Indonesia
119,832
110,847
107,581
93,180
89,607
77,291
97,998
114,322
121,991
173,598
Taiwan
207,893
202,406
191,513
186,723
172,279
169,196
196,115
170,703
143,869
153,923
Thailand
109,060
101,648
97,252
77,220
76,955
93,301
70,549
91,940
66,706
86,006
Vietnam
309
6,505
5,390
10,851
23,868
28,144
42,103
48,420
73,215
81,545
Hong
194,399
209,715
201,480
196,486
158,266
174,140
127,050
95,891
63,360
69,780
Kong
Subtotal
13,449,010
14,458,517
13,598,673
13,779,472
15,800,354
16,568,977
21,380,621
22,465,103
20,132,115
21,095,376
Other:
751,673
603,592
575,198
464,609
443,293
403,022
388,267
355,178
291,870
332,509
Total
14,200,683
15,062,108
14,173,871
14,244,081
16,243,647
16,971,999
21,768,888
22,820,281
20,423,985
21,427,885
2010 Toy Imports NAICS 33993 (In $1,000)
The top five import sources were China, Japan, Mexico, Denmark, and Canada. Chinese
produced toys accounted for approximately 88 percent of all toy imports in 2010.
U.S. apparent consumption of toys was approximately $22.2 billion in 2010 with imports from
China accounting for 85 percent of the total.
U.S. Toy Imports NAICS 33993 vs. Apparent Consumption and Toy Imports from China
U.S. and Foreign Toy Tariffs
The U.S. toy industry faces relatively low foreign tariffs. U.S. toy tariffs were reduced beginning
in 1995, and eliminated by 1999, as part of the GATT Uruguay Round "Zero-for Zero''
negotiations. Other signatories to the agreement include the European Union, Japan, and
Korea. Toy trade between Canada, Mexico and the United States is duty free under the NAFTA
agreement. As part of China's accession to the World Trade Organization (WTO), it eliminated
tariffs on most toy categories in 2005.
In 2011, Free Trade Agreements were signed with Korea, Columbia, and Panama. Current 2012 average
toy tariffs8 on U.S. made toy products are: Korea 4.7 percent; Columbia: 18.5 percent; and Panama:
10.4 percent. Toy tariffs in Korea will be reduced to zero upon implementation of the agreement. Toy
tariffs in Columbia will decrease to 0 percent after a 10 year staging. Toy tariffs in Panama will be
reduced either upon implementation, or using a five or ten year staging period.
In December 2011, Russia was invited to join the WTO as the 155th member. After full
implementation of its WTO commitments, toy tariffs which range from 5-20 percent will be
reduced and bound between 5-15 percent depending on the product category. Russia is
expected to formally join the WTO in 2012.
8 Toys are defined as chapter 95 of the U.S. Harmonized Tariff Schedule. Specific toy rates provided in this report
are for headings 9501, 9502 and 9503. FTA Tariff rates for other headings are available through the Department
of Commerce's Free Trade Agreement Tariff Tool.
U.S. toy companies still face tariffs ranging of up to 10-20 percent in South American countries
such as Brazil, and Asian countries such as Indonesia, Vietnam. For current tariffs on U.S.
products contact the Trade Information Center or call 1-800-USA-TRADE.
While U.S. toy companies generally enjoy relatively low tariffs in key export markets, they can
still encounter non-tariff barriers to these same markets. Companies that encounter problems
exporting are encouraged to report their problem to the International Trade Administration's
Trade Compliance Center. The U.S. Department of Commerce working in conjunction with
USTR and the Commercial staff at Embassies abroad have resolved numerous non-tariff trade
barriers for U.S. companies including issues pertaining to import licenses, safety standards, and
labeling requirements.
Industry Legislative Changes and Toy Recalls
In 2007, more than 45 million toys and other children's products were recalled for hazards such
as lead paint and small powerful magnets that could injure children if swallowed. Stakeholders,
including toy manufacturers, retailers, and consumer groups, participated in numerous
Congressional hearings which resulted in significant changes to the standards and testing
procedures applied to domestically produced and imported toys and children's products. On
July 31, 2008, Congress sent President Bush a compromise bill, H.R. 4040, entitled "Consumer
Product Safety Improvement Act of 2008.'' The Act impacted the U.S. toy industry in the
following ways:
� Children's products
that contain lead above 600 parts per million for the first year,
reducing to 100 parts per million beginning the third year following the enactment of the
Act, will be treated as banned hazardous substances. The limits represent some of the
lowest lead limits in the world and effectively bans lead from children's products.
� Third party testing and certification for certain children's products will be mandatory.
� Children's products will be required to bear tracking labels that would allow their path
from factory to store to be more easily retraced in the event of a recall.
� Toys and games advertised for sale on the internet and in catalogs will be required to
prominently display the same cautionary language included on product packaging
� The voluntary industry standard ASTM F-963 will become a mandatory standard overseen
by the Commission.
� Phthalates are a group of chemicals added to plastic toys and other plastic products to
make them soft and pliable. The phthalates DEHP, DBP, and BBP would be banned above
concentrations of 0.1 percent. Until the results of a Chronic Hazard Advisory Panel have
been received, the phthalates DINP, DIDP, and DNOP will be banned above concentrations
of 0.1 percent in any children's toy or childcare article that can be placed in a child's
mouth.
The Consumer Product Safety Commission website has numerous informational resources to
help stakeholders understand how the Act's requirements will be implemented including
downloadable video files of recent public meetings and timelines which summarize the
required actions pursuant to the Act.
The APEC Toy Safety Initiative
The APEC Toy Safety Initiative was the U.S. response to the many notable toy recalls of 2007,
and to APEC Leaders' calls in 2007 and 2008 to "strengthen consumer product safety standards
and practices in the region'' and "to undertake work to ensure the safety of toys.'' The project
was managed by the U.S. Department of Commerce's Office of Health and Consumer Goods
and the ITA's Standards Liaison in conjunction with USTR. The Initiative was cosponsored by
seven APEC economies: Chile, China, Chinese Taipei, Japan, Malaysia, and Viet Nam. TIA was
the U.S. private sector partner and contributed half of the operating funds. The Initiative called
for a survey of current toy regulatory practices of all APEC member economies and two events:
"A Regulator Dialogue on Toy Safety,'' held on the margins of the Singapore SCSC meeting
August 1-2, 2009; and "An Open Dialogue on Toy Safety for All Stakeholders'' (Open Dialogue)
held during the Hong Kong Toy Fair on January 12, 2010.
The two Dialogues marked the first-ever meetings of all toy industry stakeholders within the
APEC region (home to over 85% of all toy manufacturers and exporters) to discuss
opportunities and obstacles to global standards alignment. The Singapore meeting was
attended by 130 regulators from 20 of the 21 APEC economies (only Russia was not
represented). The Hong Kong meeting was attended by 214 people representing regulators,
standards bodies, toy manufacturers, retailers, toy associations, testing companies, and other
government representatives. Non-APEC attendees included Belgium, Denmark, India, Sweden
and Switzerland. There was discussion of the regulatory systems of 15 members, and the
relationship between the three main toy standards, ASTM F963, the EU's EN-71, and ISO 8124.
Key Outcomes from Singapore
? Commitment to participate in a survey of member economies regarding toy safety
systems as a deliverable to the Hong Kong meeting.
? Agreement between the ASTM and ISO technical committees to consultations on
emerging toy safety hazards.
Key Outcomes from Hong Kong
? Completion and endorsement of the APEC Toy Safety Survey and circulation of the
document to the OECD, WTO TBT Committee and related organizations.
? Agreement by APEC members to continue to pursue standards alignment in all
stakeholder groups through an industry task force, international regulator forums, and
consumer organizations under the auspices of the APEC Toy Safety Initiative.
? Commitment by CPSC to dedicate resources for global toy standards alignment in its
2010 workplan entitled "Plan for International Coordination on Toy Safety
Requirements'' (released May 2011).
Questions related to this industry report should be directed to the toy industry analyst at
Jamie.Ferman@trade.gov
Updated 4-22-2013